Machine Learning Transforms Analysis of Jockey Performance Records

Researchers in equine sports analytics have turned to machine learning models that process large volumes of jockey performance data, including ride histories, finish positions, and track conditions, to identify recurring patterns that inform race outcome forecasts. These systems draw from datasets compiled by racing authorities across multiple jurisdictions, where variables such as horse speed ratings, jockey win percentages on specific surfaces, and historical race times feed into supervised learning frameworks that classify likely outcomes with measurable accuracy rates.
Data collection efforts intensified after regulatory bodies in Australia and North America mandated standardized digital logging of race results in the mid-2010s, creating structured repositories that now exceed several million individual ride entries. Algorithms such as random forests and gradient boosting machines analyze correlations between jockey positioning tactics and final margins, while recurrent neural networks handle sequential ride sequences to detect momentum shifts over multi-race campaigns.
Data Inputs and Feature Engineering
Performance records typically include variables like average stride frequency, post-position success rates, and adaptability scores derived from past starts at varying distances. Engineers normalize these inputs against track-specific benchmarks, then apply dimensionality reduction techniques to isolate the most predictive signals. One dataset from Racing Australia, covering thoroughbred events between 2018 and 2025, supplied over 1.2 million rides that enabled models to flag jockeys who consistently outperform expected results on wet tracks by margins exceeding 15 percent.
Feature selection processes prioritize metrics with high information gain, such as the ratio of inside-barrier wins to total rides or recovery times between consecutive starts. Teams at institutions like the University of Guelph have documented how embedding these engineered features into support vector machines improves classification precision for top-three finish predictions compared with baseline statistical models.
Algorithm Types and Their Applications
Gradient boosting frameworks dominate current implementations because they handle mixed categorical and continuous variables without extensive preprocessing. These models iteratively refine decision trees that split on thresholds such as jockey experience levels or horse class ratings, yielding probability outputs that trackside analysts convert into expected value calculations. Reinforcement learning variants have also emerged, where agents simulate race scenarios using historical jockey decision patterns to optimize real-time tactical recommendations during live events.
Convolutional neural networks process visual telemetry from race footage when available, extracting spatial features like overtaking trajectories that complement tabular performance logs. Observers note that hybrid architectures combining both structured data and video-derived inputs have raised predictive recall rates in controlled tests conducted by North American racing laboratories.
Integration with Trackside Forecasting Systems
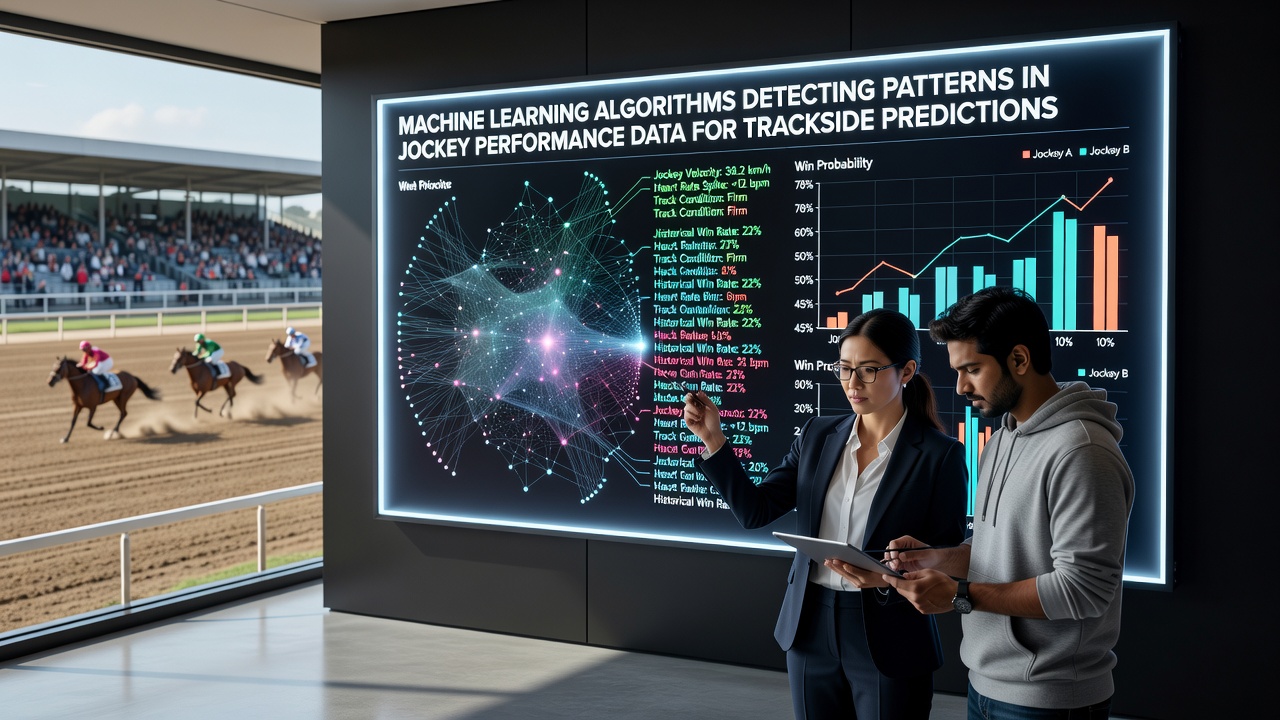
Operators integrate these trained models into dashboards that update probability estimates as new form data arrives before each meeting. The outputs feed into betting exchange interfaces and broadcast graphics, where pattern-derived confidence intervals appear alongside traditional odds. In July 2026, several North American tracks piloted live model deployments that adjusted displayed projections after each race, incorporating fresh jockey-specific adjustments derived from the most recent 50 rides.
Case studies from the Hong Kong Jockey Club illustrate how ensemble methods reduced forecast variance for sprint events by weighting recent jockey-form streaks more heavily than career averages. Similar approaches appear in European training facilities, where analysts cross-reference model alerts with video review to validate detected anomalies such as sudden improvements in rail-running efficiency.
Validation and Performance Metrics
Cross-validation protocols split historical seasons into training and test folds to guard against overfitting, with practitioners reporting area-under-curve scores above 0.78 for binary win/loss classification tasks. External audits by independent data scientists have confirmed that models maintain calibration across different track surfaces when retrained quarterly. One published evaluation in the Journal of Quantitative Analysis in Sports compared multiple algorithms against expert tipsters and found machine learning ensembles produced lower log-loss values on out-of-sample races.
Continuous monitoring tracks concept drift caused by rule changes or equipment modifications, prompting automated retraining cycles when performance metrics drop below preset thresholds. Researchers at Canadian universities have contributed open-source toolkits that standardize these monitoring pipelines for smaller racing jurisdictions lacking dedicated analytics teams.
Conclusion
Machine learning pipelines now form a core component of modern jockey performance evaluation, converting raw ride statistics into actionable pattern detections that support trackside decision frameworks. Ongoing refinements in data granularity and algorithmic architecture continue to expand the scope of detectable signals, while geographic diversification of training datasets strengthens model robustness across varied racing environments.