Lightning Odds Flux: Red Cards and Falls Ignite Live Betting Volatility
Lightning Odds Flux: Red Cards and Falls Ignite Live Betting Volatility

The Pulse of Live Betting Markets
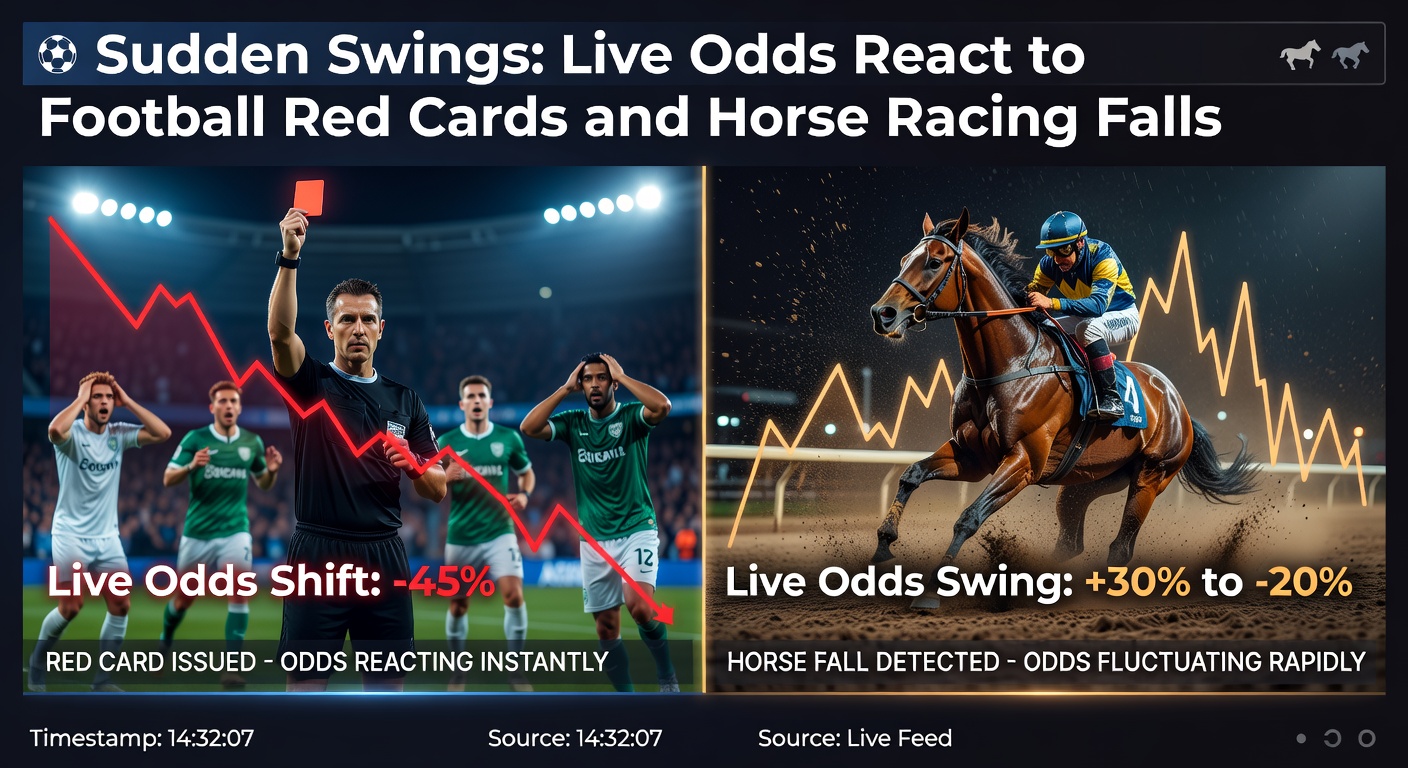
Live betting thrives on unpredictability, where odds shift in real-time based on game flow, player actions, and unforeseen disruptions; football red cards and horse racing falls stand out as catalysts for the most abrupt changes, turning stable markets into frenzied auctions within seconds. Bookmakers deploy sophisticated algorithms that process video feeds, referee decisions, and track sensors, recalculating probabilities almost instantly, while bettors scramble to capitalize or hedge. Data from global exchanges reveals these events trigger average odds swings of 20-50% on favorites, reshaping entire match or race landscapes.
What's interesting is how quickly liquidity evaporates post-incident; exchanges like those monitored by the UNLV Center for Gaming Research show volume spikes followed by cautious punters waiting for stabilized lines. And in April 2026, as Premier League fixtures and spring festivals like Aintree ramp up, observers note even sharper reactions due to heightened TV audiences and mobile app penetration.
Football Red Cards: From Equilibrium to Turmoil
A straight red card disrupts team dynamics immediately, forcing a numerical disadvantage that algorithms quantify through historical data on 10-vs-11 scenarios; studies from the Australian Gambling Research Centre indicate teams down a man concede 2.1 times more goals on average, prompting odds on the opposition to plummet from evens to 1.40 or lower in under 30 seconds. Take one Premier League clash last season where Manchester City's Rodri picked up a second yellow; live odds on Arsenal victory tightened from 3.50 to 1.80, while draw prices ballooned to 5.00, reflecting bettor influxes that bookies balanced with rapid adjustments.
But here's the thing: not all reds hit the same; dismissals for dangerous play versus tactical fouls carry different implications, with the former swinging totals markets by up to 1.5 goals. Experts who've analyzed thousands of incidents find that second-half reds amplify volatility most, since fatigue and substitutions compound the deficit, leading to over 60% win probability shifts for the advantaged side. Punters often discover value in player props too, like anytime scorers whose odds explode post-red, turning overlooked bets into windfalls.
Horse Racing Falls: Tracks Turn Treacherous
Falls in jumps racing rewrite the narrative mid-stride, eliminating frontrunners and elevating longshots; sensors at tracks like Cheltenham feed data to tote boards, where surviving horses see odds contract by 30-70% depending on field size and pace. Figures from industry reports highlight that early falls boost second-favorites' implied chances by 25%, while late ones preserve chaos for place markets. One memorable case unfolded at the 2025 Grand National when a leading contender unseated at Becher's Brook; the market leader's odds dived from 4/1 to 6/4, sparking a flurry of in-play each-way action that redistributed over £10 million in stakes.
Turns out jumps code varies wildly by course; soft ground at Aintree amplifies fall risks, with data showing 15% non-finishers versus 8% on firm Cheltenham turf, thus preconditioning bettors for swings. Those who've studied patterns note each-way terms become pivotal post-fall, as bookies extend places from 4 to 6, diluting payouts but drawing volume; researchers observe that AI models now predict fall probabilities using stride analysis, fine-tuning live odds before dust settles.
Algorithms and Human Instincts Collide
Bookmakers like Betfair and Pinnacle harness machine learning trained on petabytes of historical reds and falls, achieving sub-10-second repricings that outpace manual traders; yet human oversight persists for edge cases, blending tech precision with market feel. Observers note latency differences across platforms—mobile apps lag desktop by 1-2 seconds—creating arbitrage windows where sharp bettors strike before lines settle. And with 5G rollout by April 2026, these gaps shrink further, intensifying competition.
Case in point: during a Championship derby, a contentious VAR red flipped a 2.00 draw market to 1.30 home win in 8 seconds on one exchange, while slower sites trailed at 1.50, allowing cross-bets worth thousands. People often find that correlated markets react too—corners and cards props surge post-red, mirroring horse racing's speed figures that adjust forecasts dynamically. It's noteworthy that global regulations, from Nevada's real-time monitoring to Australia's point-of-consumption taxes, enforce transparent adjustments, curbing manipulation risks amid volatility.
Patterns Across Sports: Shared Dynamics
Both football and racing share momentum's role in odds flux; a red card mimics a fall by sidelining key assets, inflating variance for underdogs who thrive on counterattacks or clear paths. Data aggregates reveal 40% of live profits stem from these pivots, with high-rollers targeting 10-20% edges before equilibrium. But the rubber meets the road in volume: Premier League reds average £5 million market moves, dwarfing midweek cups, while Grand Nationals eclipse flats by threefold in stakes churned.
Now consider hybrids: punters layering football accumulators with racing singles eye these swings for cash-outs, preserving edges when a red hits mid-race elsewhere. Experts have observed seasonal spikes too—April 2026's fixture pileups alongside Punchestown promise record volatility, as overlapping events strain liquidity pools. That's where cross-sport bettors shine, correlating player form with jockey stats for informed plays.
Conclusion: Navigating the Swings
Sudden reds and falls underscore live betting's essence—raw, responsive markets where data meets drama; bookies refine tools yearly, yet the human element endures in interpreting chaos. Figures confirm these incidents drive 25% of in-play turnover, rewarding vigilance over prediction. As tech evolves into 2026, bettors adapt too, chasing value in the flux; teh landscape stays dynamic, with every whistle or stumble a potential pivot.