Data Analytics Elevating Accumulator Tactics in Football and Horse Racing Circuits

Accumulator bets combine multiple selections into a single wager where every leg must succeed for the bet to pay out, and data analytics now shapes how these combinations get constructed across football leagues and thoroughbred racing events. Bettors and operators alike draw on vast datasets that include player performance histories, team formations, track conditions, and historical race outcomes to identify combinations with improved probability profiles rather than relying solely on intuition or basic odds comparison.
Core Data Inputs Driving Accumulator Construction
Football accumulators typically stack goals, corners, player assists, and clean sheets across several matches, while equine versions link winners or place finishes from multiple races on the same card or across meetings. Analysts compile variables such as expected goals models, passing networks, and pace figures for horses, then feed them into algorithms that calculate joint probabilities for the entire slip. These models adjust for correlations between events, for instance recognizing that heavy ground at one venue may affect multiple races in a sequence, so the software flags accumulators where surface conditions align favorably across selections.
Integration of Real-Time Feeds and Predictive Modeling
Live data streams from stadium sensors and GPS trackers on horses allow models to update probabilities during events, enabling bettors to adjust legs mid-card when early information shifts expected values. In June 2026 several European racing authorities began publishing enhanced sectional timing data that feeds directly into accumulator engines, giving users granular splits for each furlong that refine late-race stamina projections. Machine learning systems compare current form against thousands of past parallels, surfacing accumulator combinations where underpriced legs appear because public markets have not yet incorporated recent training metrics or weather pattern changes.
Comparative Applications Across Sports and Racing
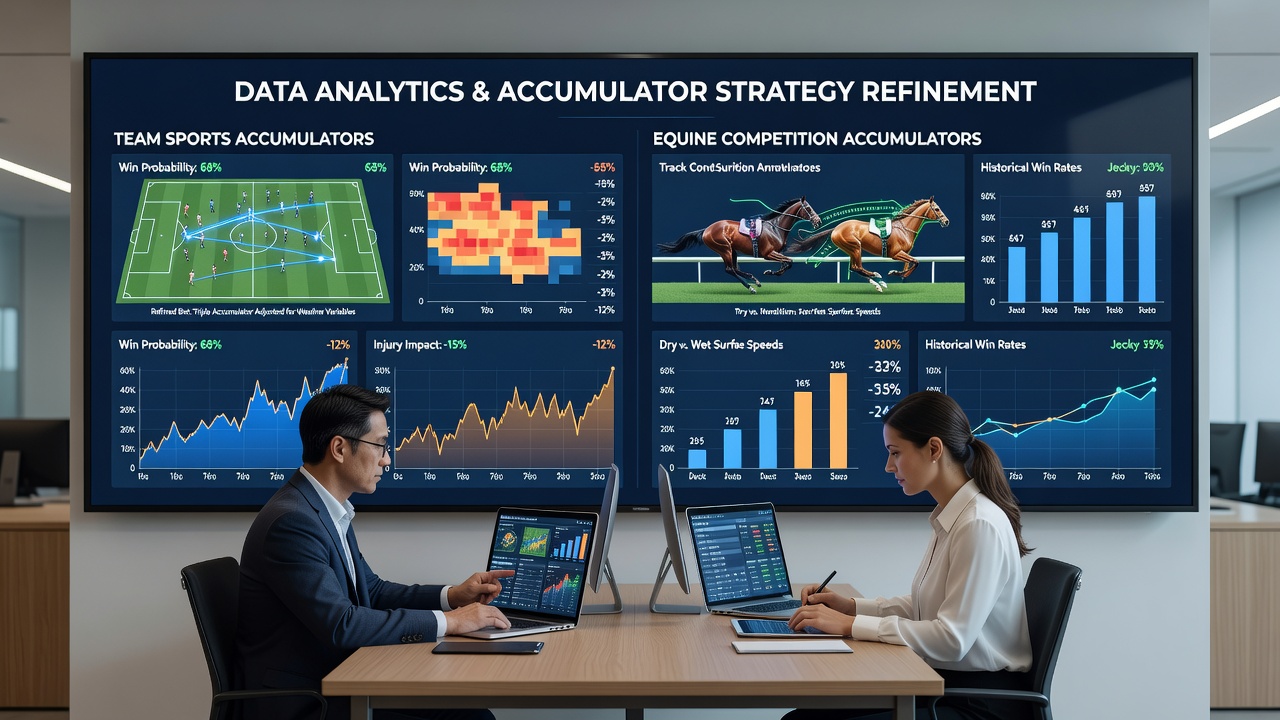
Team sports data sets emphasize possession percentages, set-piece efficiency, and injury timelines that affect squad depth, whereas equine analytics focus on speed ratings, draw bias, and trainer strike rates at specific tracks. Both domains now employ similar clustering techniques that group correlated outcomes, such as identifying midweek football fixtures where travel fatigue elevates draw probabilities or recognizing sprints where early pace collapses increase the chance of long-priced closers. Observers note that these clustering outputs help users avoid accumulators containing mutually exclusive legs, for example pairing two high-pressing teams whose styles reduce combined goal tallies.
Regulatory and Industry Data Sharing Trends
Industry bodies such as the European Gaming and Betting Association have documented rising adoption of standardized data protocols that let operators share anonymized historical betting and outcome records. These shared repositories improve model training sets without exposing individual user information, allowing smaller syndicates and independent analysts to access broader sample sizes previously available only to large bookmakers. Academic researchers from institutions including the University of Sydney have published peer-reviewed work showing how ensemble methods combining gradient boosting with neural networks outperform traditional regression approaches when forecasting multi-leg accumulator success rates in both football and harness racing datasets.
Practical Implementation Examples
One documented workflow involves scraping public fixture lists, merging them with proprietary expected-goals databases, then running Monte Carlo simulations that output thousands of potential four-leg and five-leg slips ranked by estimated edge. In racing, syndicates combine official form guides with private GPS data from gallops to isolate races where a horse's closing sectional suggests it will handle a step up in trip, then stack that selection with similarly vetted runners from later meetings. These processes run on cloud infrastructure that completes thousands of simulations within minutes, delivering updated accumulator rankings right up to the first race or kickoff.
Conclusion
Data analytics continues to reshape accumulator construction by supplying quantifiable edges derived from integrated statistical sources rather than isolated observations. As datasets expand through improved tracking technology and cross-jurisdictional sharing agreements, the precision of joint probability estimates for both football and equine accumulators is expected to increase further, giving disciplined users structured methods for selecting and sizing multi-leg wagers.